One Dashboard.
All the Key Metrics.
No more jumping between modules or reports.
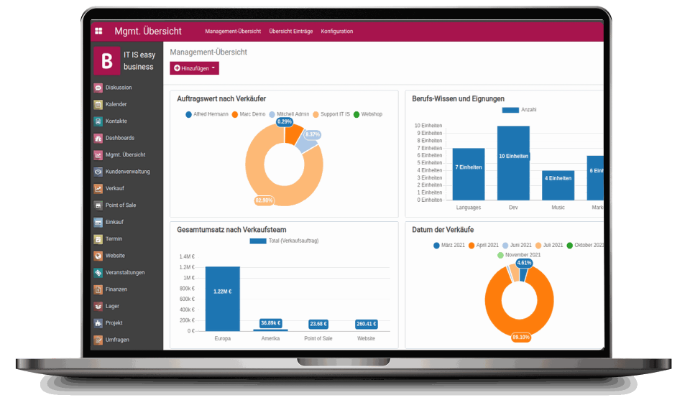
With the ITISeasy Management Dashboard, executives and decision-makers get instant access to what matters most.
Get a quick and clear overview of your sales performance, your project progress, or your team's productivity in general.
Compare revenue vs. expenses, outstanding invoices and inventory levels without any effort and from everywhere!
Stay in control — from anywhere, anytime.

One Dashboard.
All the Key Metrics.
No more jumping between modules or reports.
With the ITISeasy Management Dashboard, executives and decision-makers get instant access to what matters most.
Sales Performance
Revenue vs. Expenses
Outstanding Invoices
Project Progress
Inventory Levels
Team Productivity
Stay in control — from anywhere, anytime.
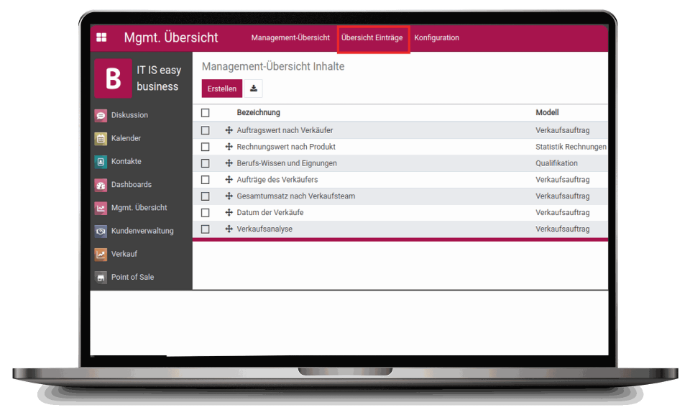
View Existing Entries at a Glance
Your current analyses, KPIs, and charts are clearly listed in the dashboard configuration view.
Rearrange them with ease, remove outdated reports and p rioritize what’s important.
A clutter-free overview for fast and focused decisions.
View Existing Entries at a Glance
Your current analyses, KPIs, and charts are clearly listed in the dashboard configuration view.
Rearrange them with ease
Remove outdated reports
Prioritize what’s important
A clutter-free overview for fast and focused decisions.
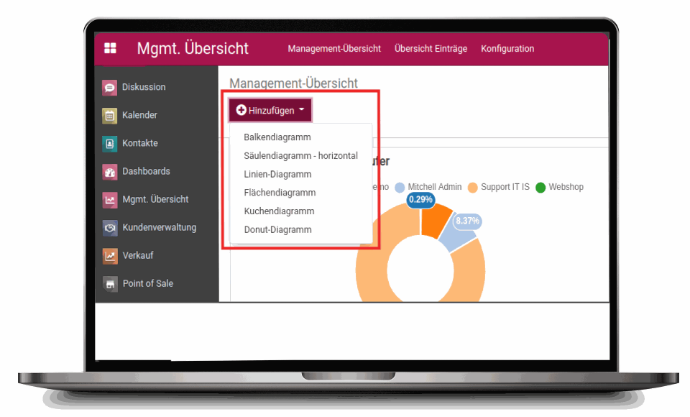
Customize Charts
Your Way
Not all businesses are the same — neither are your KPIs.
That’s why ITISeasy.business allows you to build custom charts and define what to monitor.
Customize Charts
Your Way
Not all businesses are the same — neither are your KPIs.
That’s why ITISeasy.business allows you to build custom charts and define what to monitor.
Choose Your
Chart Type:
Bar chart
Pie chart
Line graph
KPI cards
Summary tables
Select Your
Data Source:
Sales Orders
Purchase History
Timesheets
CRM Pipelines
Project Milestones
Control Your
View:
Filter by department, time, location, or team
Save multiple dashboards per role (e.g., CEO, Sales Lead, Finance Manager)

Drag & Drop Simplicity
Set up your management dashboard without any technical skills. Use intuitive drag-and-drop controls to
organize blocks, rearrange charts, and highlight what matters most.
Drag & Drop Simplicity
Set up your management dashboard without any technical skills. Use intuitive drag-and-drop controls to
organize blocks, rearrange charts, and highlight what matters most.
Real-Time Sync with ITISeasy Modules
All KPIs on your dashboard are dynamically linked with other modules in ITISeasy.business:
Sales & CRM
Project Management
Finance & Accounting
HR & Timesheets
Inventory & Logistics
One update across the system reflects everywhere.
Real-Time Sync with ITISeasy Modules
All KPIs on your dashboard are dynamically linked with other modules in ITISeasy.business:
Sales & CRM
Project Management
Finance & Accounting
HR & Timesheets
Inventory & Logistics
One update across the system reflects everywhere.
Export or Share Insights Instantly
With just one click, you can email your dashboard to stakeholders, export charts as PDFs or Excel and access dashboards on mobile or tablet.
Great for meetings, reviews, or weekly stand-ups!
Secure & Role-Based Access
Only authorized team members can access specific dashboards. Assign visibility based on u ser roles, departments or c ustom permissions.
Export or Share Insights Instantly
With just one click, you can:
Email your dashboard
to stakeholders
Export charts as PDFs or Excel
Access dashboards on
mobile or tablet
Great for meetings, reviews, or weekly stand-ups!
Secure & Role-Based Access
Only authorized team members can access specific dashboards. Assign visibility based on:
User roles
Departments
Custom permissions
Use Case: The CFO’s
Daily Dashboard
Outstanding receivables
Top 10 overdue payables
Department-wise expense breakdown
Month-to-date profit & loss
Cash in/out forecast
Make every financial decision based on real-time data — no more guessing.
Use Case: The CFO’s Daily Dashboard
Outstanding receivables
Top 10 overdue payables
Department-wise expense breakdown
Month-to-date profit & loss
Cash in/out forecast
Make every financial decision based on real-time data — no more guessing.
Why ITISeasy Management Dashboard?
Built-in with your ERP – no integrations needed
100% customizable with visual controls
Lightning-fast performance even with large datasets
Role-specific dashboards for Sales, Finance, HR, CEO, and more
Designed for clarity, simplicity, and speed
Why ITISeasy Management Dashboard?
Built-in with your ERP – no integrations needed
100% customizable with visual controls
Lightning-fast performance even with large datasets
Role-specific dashboards for Sales, Finance, HR, CEO, and more
Designed for clarity, simplicity, and speed
Ready to Take Control of Your Business KPIs?
ITISeasy.business gives you the bird’s-eye view to make smarter, faster decisions.
Contact us for more information Request a live demo today
Explore our Business Intelligence Features Learn more about ITISeasy.business ERP
Ready to Take Control of Your Business KPIs?
ITISeasy.business gives you the bird’s-eye view to make smarter, faster decisions.
Explore our Business Intelligence Features Learn more about ITISeasy.business ERP